
See the system
Make demand, coverage, workload and performance visible.
Operational data becomes useful when it is connected to place, time and context. We combine analytics with geospatial intelligence to turn raw records into defensible decisions.
See where the system changes.
Explore demand, travel, workload, coverage and reliability as connected operating conditions, not isolated dashboard measures.
DemandCoverageTravel timeWorkload
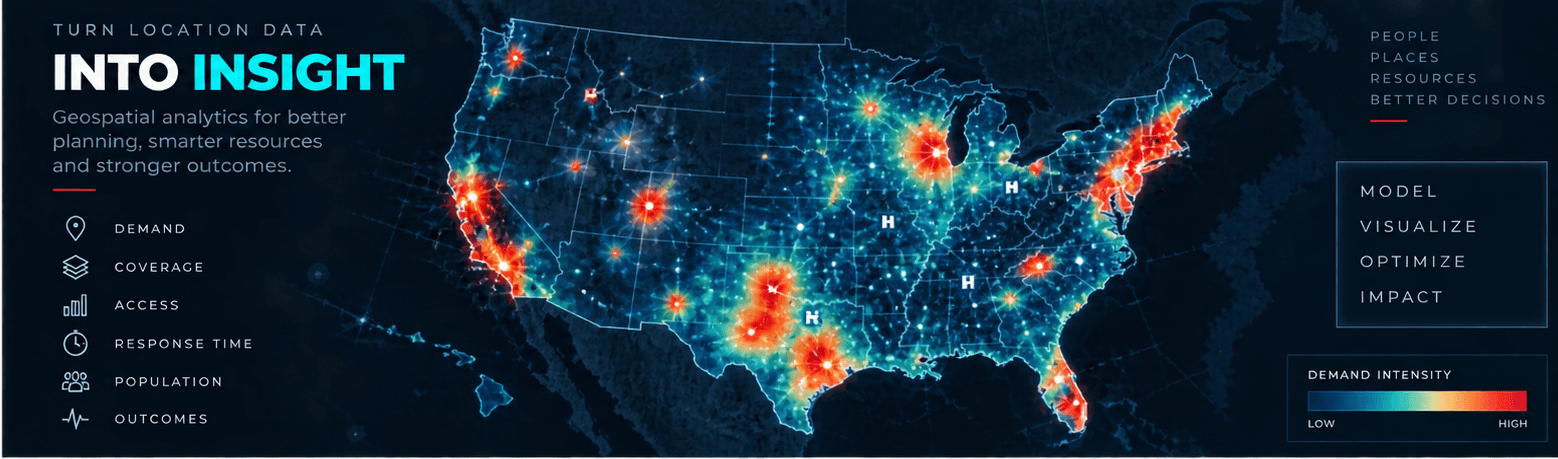
National demand intelligence
Reveal where demand concentrates, how access changes and where resources can create the greatest impact.
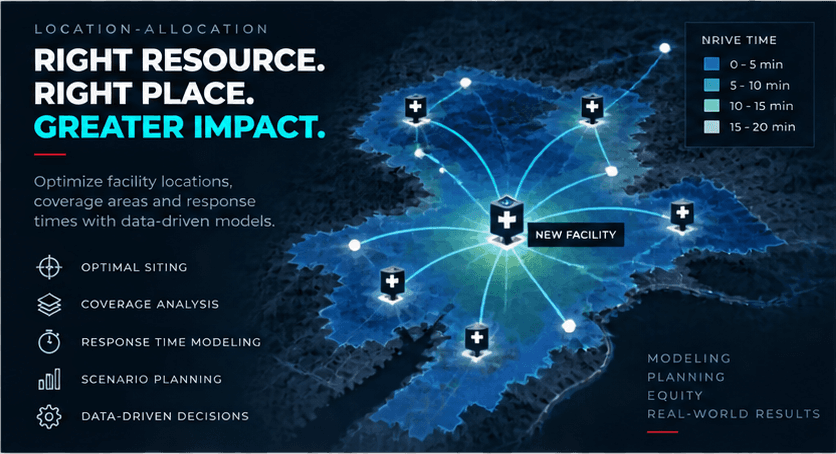
Location-allocation
Test facility locations, coverage areas and response times against real operating conditions.
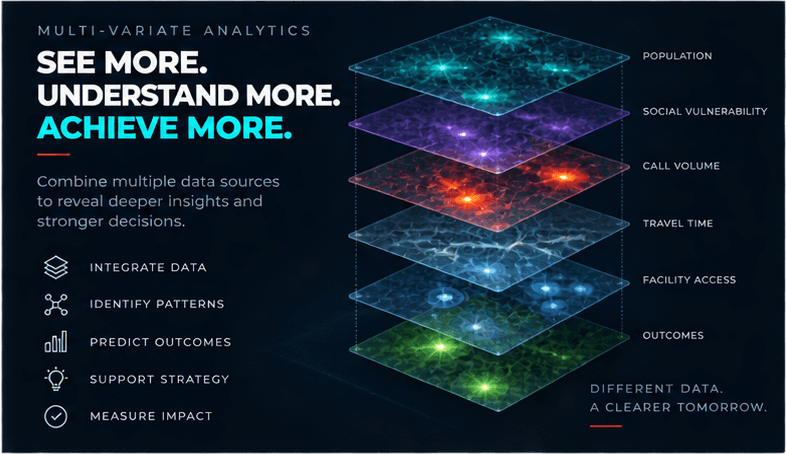
Multi-variable analytics
Connect population, vulnerability, call volume, travel time, access and outcomes in one defensible view.
Problems we help solve
Start with what is not working.
- Averages hide where performance breaks down
- CAD and ePCR data are difficult to trust or connect
- Leaders cannot see workload and coverage tradeoffs
- Station, post or deployment decisions lack spatial evidence
Services
Focused support across the problem.
01CAD and ePCR analytics
02Response-time and demand analysis
03GIS and spatial analysis
04Station and post location-allocation
05Coverage and workload visualization
06Dashboards
07Demographic and economic overlays
08Benchmarking
09Data-quality assessment
10Reporting architecture
How we work
A practical path from evidence to action.
- 01Assess source quality
- 02Build a reproducible analytical model
- 03Test spatial and operational assumptions
- 04Translate findings into decisions
Start a conversation